e-Mathematics > Probability and Statistics
for 3470-001 student.

Hypergeometirc Distributions

Suppose we have a lot of size
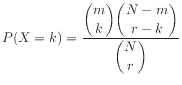
 $ N = 100$ containing $ m = 20$ defectives. When $ r = 10$ random items are sampled and inspected, the probability that we will find $ X = k$ defectives in the sample follows the hypergeometric distribution

$\displaystyle P(X = k) = \frac{\displaystyle\binom{m}{k} \binom{N-m}{r-k}}{\displaystyle\binom{N}{r}}
$

The value $ k$ is valid when $ \max\{0,r+m-N\} \le k \le \min\{m,r\}$. The mean and the variance are given as follows:

$\displaystyle E[X] = \dfrac{r m}{N}$    and $\displaystyle \quad
\textrm{Var}(X) = \dfrac{r m (N-m) (N-r)}{N^2 (N-1)}
$

The frequency function dhyper() is used to obtain a hypergeometric distribution. We can sample from hypergeometric distribution by rhyper(), and compare it with the frequency function in a relative frequency histogram.

N = 100
m = 20
r = 10
size = 200
x = 0:r
prob = dhyper(x,m,N-m,r)
sample = rhyper(size,m,N-m,r)
hist(sample, freq=F, breaks=seq(-0.5,r+0.5,by=1.0), ylim=c(0,max(prob)+0.1), col='green')
prob.mass(x,prob,lty=2)
cat(sample)
cat("\n sample mean =", mean(sample))
cat("\n sample var =", var(sample))
cat("\n E[X] =", m*r/N)
cat("\n Var(X) =", m*r*(N-m)*(N-r)/(N^2*(N-1)))

Programming Note. ylim=c(0,max(prob)+0.1) determines the range of y-axis. Here we need it to adjust the height so that it displays the highest value (mode) from the probability mass function.

Sample R code. You can download hyperdemo.R, and run it.


© TTU Mathematics