The coefficients

and

of the linear regression
model
are called the
intercept and the
slope parameters, respectively.
The data set consists of
- explanatory variable
for
 's;
's;
- dependent variable
for
 's.
's.
Then the point estimates

and

of the parameters
and
are obtained as follows.

=
and

=
.
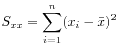
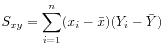
Here the values
 ,
,  ,
,  , and
, and  are computed as in the
following table.
are computed as in the
following table.
| Variable |
Mean |
Sum of squares |
| Explanatory |
 |
 |
| Response |
 |
 |
Fitted model.
The fitted linear model
is called the
prediction equation
(or the
regression line).
The scatter plot together with regression line
(which should appear below when it is produced)
suggests how well the line fits along the data.
Correlation.
The sample correlation

=
.
describes the strength of linear relationship for the pair

of data.
Here
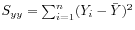
is the sum of squares within the response variable
's.
The value

is always between

and

.
The value
is close to
when the pairs lie close to the straight line
with positive slope,
and it is close to
when it is aligned with a negative slope.
© TTU Mathematics

