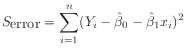
The residual sum of squares
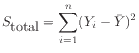
and the total sum of squares
are introduced.
They are used to calculate

and the error variance

.
The data set consists of
- explanatory variable
for
 's;
's;
- dependent variable
for
 's.
's.
The coefficient of determination
takes a value between 0 and 1,
and represents the proportion which can be explained by the linear regression.
The value
indicates how close the data points are
to the regression line as
gets larger,
and it is simply the square of the sample correlation coefficient

.
can be obtained as the point estimate of the variance  of error terms.
© TTU Mathematics