
Predicting Responses
For the new value
The data set consists of
- explanatory variable
for
 's;
's;
- dependent variable
for
 's.
's.
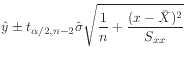
By providing the explanatory value ![]() on the column 'X',
the above table produces the corresponding fitted value
on the column 'X',
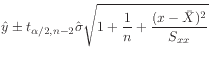
the above table produces the corresponding fitted value ![]() along with the interval
(Lower,Upper) of choice explained above.
along with the interval
(Lower,Upper) of choice explained above.
The predicted values (solid line) together with the interval of choice (dashed line or blue cross) suggests how well the new values can be predicted.
© TTU Mathematics