
Analysis of Variance
A model assumes the group mean often represents a baseline
(for which the mean of control group is considered),
and the contrast
often represents a baseline
(for which the mean of control group is considered),
and the contrast
 is known as the i-th factor effect.
The data can be arranged in a form of grouped data
which is "grouped by" the column of categorical variable indicating factor levels.
Statistical inference begins with
calculation of the sample mean
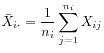 within group for every factor level
![]() ,
which is the point estimate of
,
which is the point estimate of ![]() .
It is also useful to obtain the sample standard deviation within factor level,
that is, the square root of
.
It is also useful to obtain the sample standard deviation within factor level,
that is, the square root of
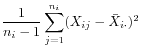 .
.
The overall sample mean
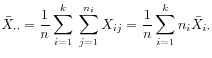 =
=
AOV model.
We assume
(i) the same variance ![]() for different groups,
and (ii) the independent normal random variable
for different groups,
and (ii) the independent normal random variable

-
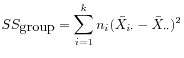 is the sum of squares between groups,
having
is the sum of squares between groups,
having
 degrees of freedom.
Thus, the mean squares is given by
degrees of freedom.
Thus, the mean squares is given by
-
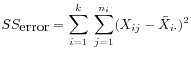 is the sum of squares within groups,
having
is the sum of squares within groups,
having
 degrees of freedom.
Thus, the mean squares is given by
degrees of freedom.
Thus, the mean squares is given by
-
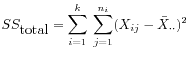 is the total sum of squares,
having
is the total sum of squares,
having
 degrees of freedom.
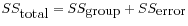
It can be decomposed into
degrees of freedom.
It can be decomposed into
Hypothesis test. Hypothesis test to detect “some effects” of factor level becomes
 versus
  for some pair
![]() =
=
has an F-distribution with
![]() = (
,
)
= (
,
)
degree of freedom.
By
 we denote the critical point
satisfying
we denote the critical point
satisfying
 where X is the F-distributed random variable.
In the hypothesis test
we reject
where X is the F-distributed random variable.
In the hypothesis test
we reject ![]() with significance level
with significance level ![]() when the
observed value F = x satisfies x >
.
Or, equivalently we can compute the p-value
when the
observed value F = x satisfies x >
.
Or, equivalently we can compute the p-value
![]() and
reject
and
reject ![]() when
when
![]() .
.
© TTU Mathematics