
Comparison of Two Proportions
If the above data contains a two-by-two contengency table then "observations" must be summarized in one column consisting of the counts of the specific response from the two groups, group 1 and 2.
X = and Y =
The sum of observed column (as indicated above) and non-observed column (specified here) provides the respective sample sizes of group 1 and 2. If no data of contingency table is accompanied then the values of X, Y, n, and m must be manually entered.
n = and m =
Here we are interested in whether there is discrepancy in occurrence of a specific type between two groups, say group 1 and 2. In terms of hypothesis test it becomes
where ![]() and
and ![]() are the respective population proportions from group 1 and 2.
Then the test statistic is calculated as
are the respective population proportions from group 1 and 2.
Then the test statistic is calculated as
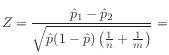
where
![]() and
and
![]() are the point estimates of
are the point estimates of ![]() and
and ![]() .
.
is called a pooled estimate of the common population proportion
under
![]() .
Having constructed the alternative hypothesis
.
Having constructed the alternative hypothesis ![]() as above,
we can make our decision via
p-value =
.
as above,
we can make our decision via
p-value =
.
The confidence interval for the difference ![]() of two proportions
can be calculated by
of two proportions
can be calculated by
= ( , )
© TTU Mathematics