
Goodness of Fit
In the experiment on pea breeding Mendel's theory predicts the probabilities of occurrence associated with the types of progeny, say “round yellow”, “wrinkled yellow”, “round green”, and “wrinkled green.” Here we want to test whether the data from
The model probabilities
 of subjects in i-th group
is calculated from the model probabilities by
of subjects in i-th group
is calculated from the model probabilities by

The observed numbers of subjects
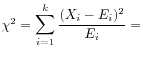
Under the null hypothesis that the model probabilities are correct,
the distribution of Pearson's chi-square ![]() is approximated by
chi-square distribution
with
(k-1) =
degrees of freedom.
Therefore,
we can reject the null hypothesis
if you observe that the test statistic
is approximated by
chi-square distribution
with
(k-1) =
degrees of freedom.
Therefore,
we can reject the null hypothesis
if you observe that the test statistic ![]() is larger than the critical point
is larger than the critical point
 ,
casting doubt on the validity of the model.
Or equivalently, by computing the
,
casting doubt on the validity of the model.
Or equivalently, by computing the ![]() -value
-value

with a random variable X having the chi-square distribution
with (k-1) degrees of freedom,
we can find that the null hypothesis is rejected if
![]() .
.
© TTU Mathematics